---
title: "Adverse Advertising Amplification"
description: "How small changes in consumer sentiment can have outsized effects for advertisers."
author: "Adam Fillion"
date: "2026-02-15"
categories: [advertising, systems-thinking, simulation]
draft: false
---
In 2020, I started a small business that sold custom products to a niche market. The uptake was great, and margins were good. I wanted to expand reach beyond organic traffic, so I did the natural thing and ran cost-per-click advertising campaigns on Facebook and the like.
When selling a product for $50, the total cost of each sale should be less than $50. At my scale, the only cost variable was customer acquisition - how many clicks do I pay for, and how much do I pay per click, before I get one sale.
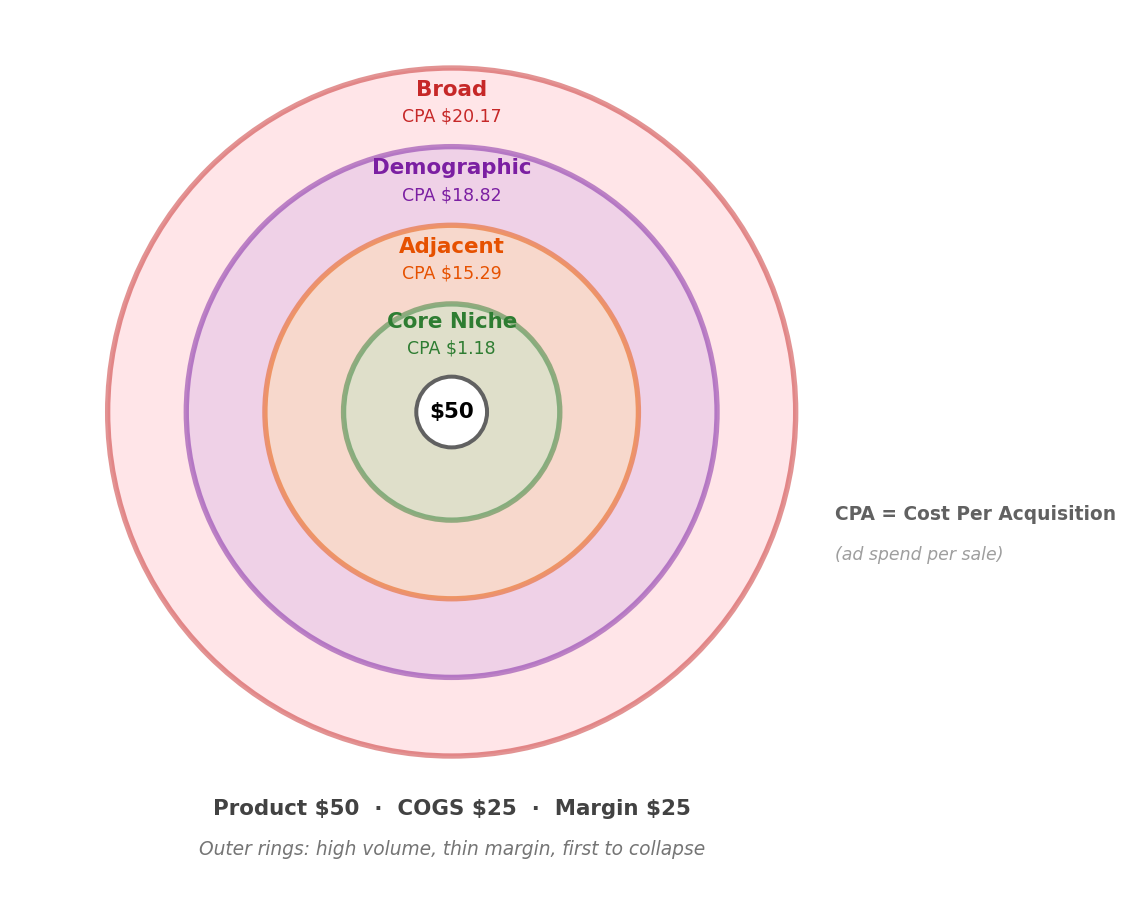
Since the product was niche, I could run highly specific ads on low-competition advertising segments, with great return. $50 sale, $25 to produce and ship, and about $5 to acquire a customer.
The problem is you quickly saturate the targeted niche. You can broaden the audience to drive volume but in doing so you reduce the product-market-fit. The implication is that cost-per-acquisition increases, total sale volume increases, margins decrease, but profit still increases.
I like to think of this advertising dilemma as a series of concentric rings, where each ring represents expanding the advertising campaign to a broader audience [[1]](#references). The advertising platform, not the seller, benefits **most** from this expansion - this shouldn't be surprising.
```{python}
#| code-fold: true
#| label: fig-segment-rings
#| code-summary: "Show diagram code"
#| out-width: 100%
#| fig-align: center
#| fig-cap: "Concentric rings of audience expansion. Outer rings trade margin for volume."
import matplotlib.pyplot as plt
import matplotlib.patches as mpatches

PRICE = 50
COGS = 25
MARGIN = PRICE - COGS  # $25

# Segment economics at base sentiment ~0.85
# CPA = CPC / (conv_rate × sentiment)
tiers = [
    {"name": "Core Niche", "consumers": 1_000, "cpa": 1.18,  "breakeven": 0.04,
     "color": "#2E7D32", "bg": "#C8E6C9", "radius": 0.55},
    {"name": "Adjacent",   "consumers": 1_500, "cpa": 15.29, "breakeven": 0.52,
     "color": "#E65100", "bg": "#FFE0B2", "radius": 0.95},
    {"name": "Demographic","consumers": 3_000, "cpa": 18.82, "breakeven": 0.64,
     "color": "#7B1FA2", "bg": "#E1BEE7", "radius": 1.35},
    {"name": "Broad",      "consumers": 4_500, "cpa": 20.17, "breakeven": 0.69,
     "color": "#C62828", "bg": "#FFCDD2", "radius": 1.75},
]

fig, ax = plt.subplots(figsize=(6, 6))
ax.set_xlim(-2.2, 2.2)
ax.set_ylim(-2.4, 2.0)
ax.set_aspect("equal")
ax.axis("off")

# Draw rings outer → inner so inner paints over outer
for t in reversed(tiers):
    ax.add_patch(plt.Circle((0, 0), t["radius"], fc=t["bg"], ec=t["color"], lw=2, alpha=0.5))

# Center product dot
ax.add_patch(plt.Circle((0, 0), 0.18, fc="white", ec="#616161", lw=1.5))
ax.text(0, 0, f"${PRICE}", ha="center", va="center", fontsize=8, fontweight="bold")

# Label each ring band (name + CPA only)
band_mids = [0.37, 0.75, 1.15, 1.55]
for y, t in zip(band_mids, tiers):
    ax.text(0, y + 0.06, t["name"], ha="center", fontsize=8, fontweight="bold", color=t["color"])
    ax.text(0, y - 0.07, f'CPA ${t["cpa"]:.2f}',
            ha="center", fontsize=6.5, color=t["color"])

# Legend
ax.text(1.95, -0.55, "CPA = Cost Per Acquisition", ha="left", fontsize=7,
        fontweight="bold", color="#616161")
ax.text(1.95, -0.75, "(ad spend per sale)", ha="left", fontsize=6.5,
        fontstyle="italic", color="#9E9E9E")

# Summary
ax.text(0, -2.05, f"Product ${PRICE}  ·  COGS ${COGS}  ·  Margin ${MARGIN}",
        ha="center", fontsize=8, fontweight="bold", color="#424242")
ax.text(0, -2.25, "Outer rings: high volume, thin margin, first to collapse",
        ha="center", fontsize=7, fontstyle="italic", color="#757575")

fig.tight_layout()
plt.show()
```
At the outer rings, profit margins are squeezed but total profit for the seller remains healthy, while profit for the advertiser is maximized. But the seller's tight profit margin exposes an effect I call **adverse advertising amplification (aaa)**: small downard changes in consumer behaviour hurt the seller, but the negative effects are amplified for the advertiser. This is because the outer rings are the first advertising segments that will be shut down, and they are the least profitable for the seller, but the most profitable for the advertiser. In other words, the advertiser's profits are a leveraged function of the seller's total volume.
It's fairly easy to make an idealized model of what I just described, but the real world is a bit messier than that, so simulation can be useful (plus I'm looking for a reason to use the simulation [[4]](#references) [library](https://github.com/adamfilli/happy-simulator/tree/main/happysimulator) I'm working on).
For this simulation, 10k consumers from different segments with different behaviours use a platform and are offered ads that cost the seller per click. When the seller notices they are profitable in the $Nth$ segment, they will expand their advertising to the $(N+1)$th segment, and vice versa.
Here are the segment characteristics:
| Segment | Consumers | Click Rate | Conversion Rate | Cost Per Click | CPA |
|---------|-----------|------------|-----------------|----------------|-----|
| **Core Niche** | 1,000 | 8% | 50% | $0.50 | $1.18 |
| **Adjacent** | 1,500 | 5% | 20% | $2.60 | $15.29 |
| **Demographic** | 3,000 | 3% | 10% | $1.60 | $18.82 |
| **Broad** | 4,500 | 1.5% | 7% | $1.20 | $20.17 |
The core niche is small but highly engaged - half of clicks convert to sales, and clicks are cheap. Each ring outward adds more consumers but with lower engagement and worse conversion. The broad segment has 4x the audience of the core niche, but acquiring a customer costs 17x more.
The simulation then manipulates a global variable - consumer sentiment, which tweaks the conversion rate for all segments.
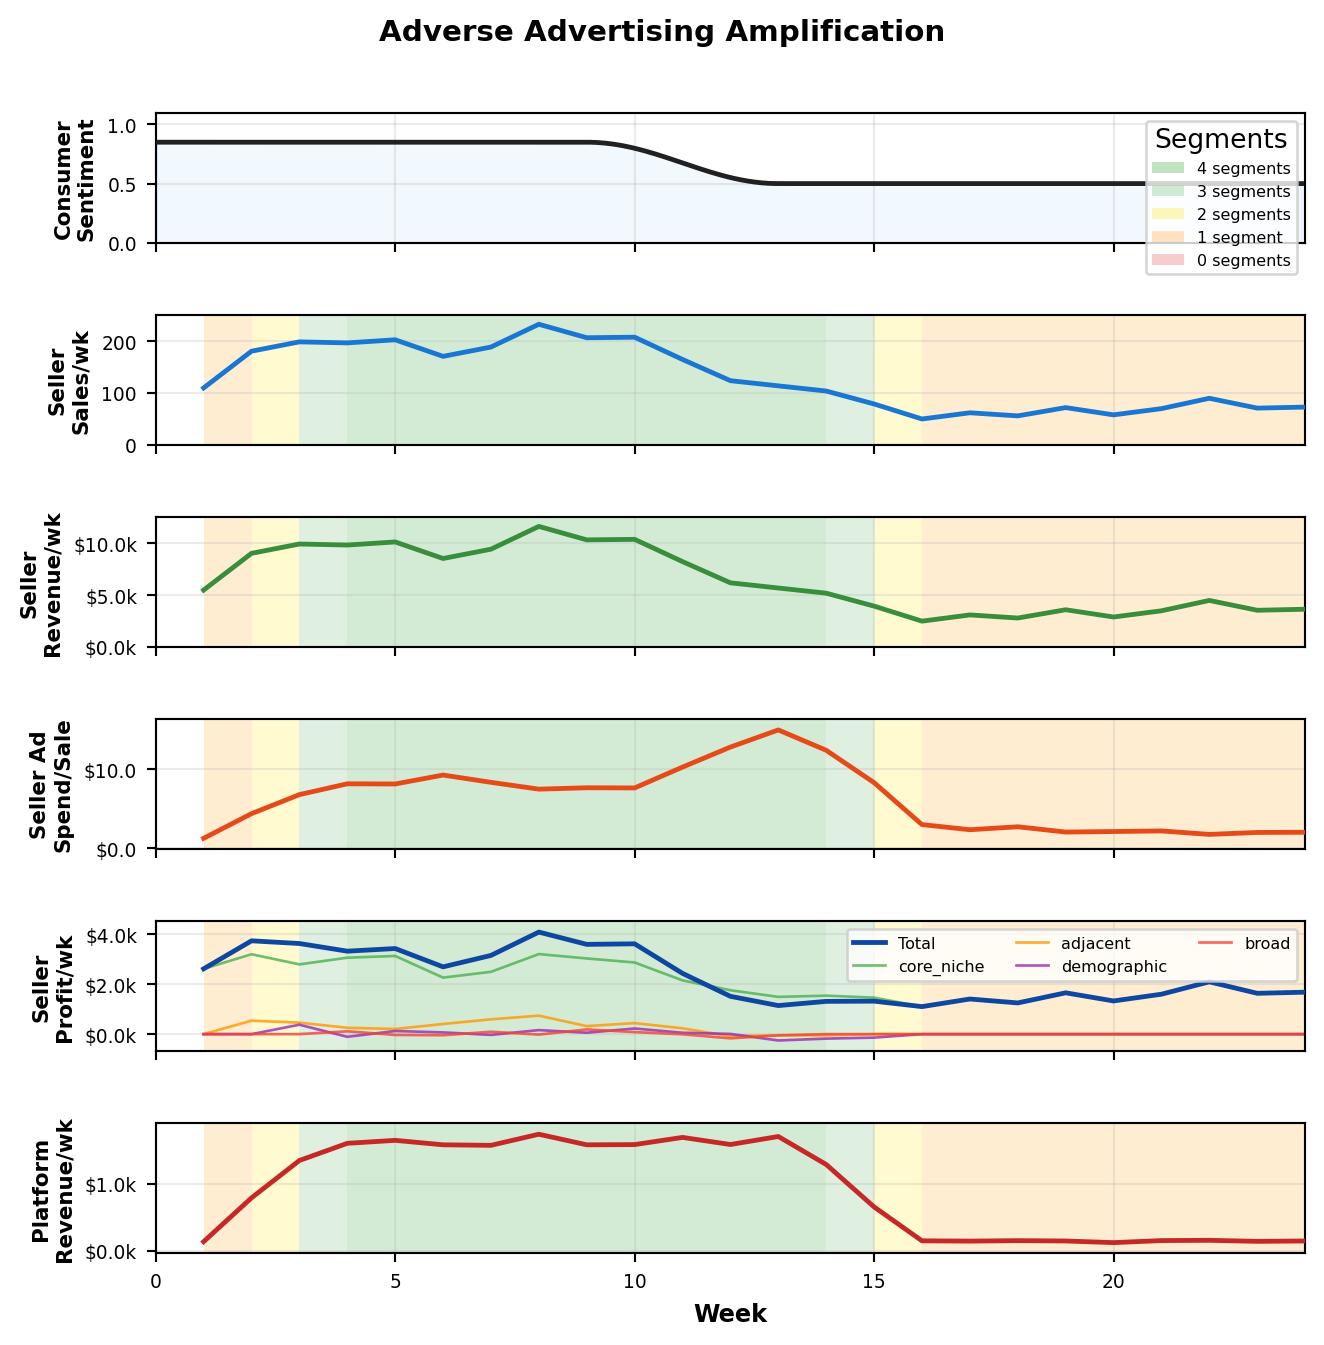
From this, we can simulate the **aaa** effect:
{width=100%}
```{python}
#| code-fold: true
#| label: fig-aaa-simulation
#| code-summary: "Show simulation code"
#| out-width: 100%
#| fig-cap: "Strong consumer sentiment causes the seller to expand at first. Once sentiment declines, advertiser revenue collapses."
import math
import random
from dataclasses import dataclass

from happysimulator import Data, Duration, Entity, Event, Instant, Simulation, Source

# ── Constants ──
HOURS_PER_WEEK = 168
DURATION_WEEKS = 24
DURATION_HOURS = DURATION_WEEKS * HOURS_PER_WEEK

PRODUCT_PRICE = 50.0
COGS = 25.0
MARGIN = PRODUCT_PRICE - COGS

SEED = 42

SEGMENTS = {
    "core_niche":   {"size": 1_000, "click_rate": 0.08,  "conv_rate": 0.50, "cpc": 0.50},
    "adjacent":     {"size": 1_500, "click_rate": 0.05,  "conv_rate": 0.20, "cpc": 2.60},
    "demographic":  {"size": 3_000, "click_rate": 0.03,  "conv_rate": 0.10, "cpc": 1.60},
    "broad":        {"size": 4_500, "click_rate": 0.015, "conv_rate": 0.07, "cpc": 1.20},
}
SEGMENT_NAMES = list(SEGMENTS.keys())
TOTAL_CONSUMERS = sum(s["size"] for s in SEGMENTS.values())

VISIT_RATE_PER_CONSUMER = 3.5 / HOURS_PER_WEEK
AGGREGATE_VISIT_RATE = TOTAL_CONSUMERS * VISIT_RATE_PER_CONSUMER

SENTIMENT_DECLINE_START = 9 * HOURS_PER_WEEK
SENTIMENT_DECLINE_END = 13 * HOURS_PER_WEEK
SENTIMENT_DECLINE_TARGET = -0.35

EVAL_INTERVAL = HOURS_PER_WEEK
SATURATION_INCREASE = 0.02
SATURATION_DECAY = 0.10

_REGIME_COLORS = {0: "#ef9a9a", 1: "#ffcc80", 2: "#fff176", 3: "#a5d6a7", 4: "#81c784"}
_REGIME_LABELS = {0: "0 segments", 1: "1 segment", 2: "2 segments", 3: "3 segments", 4: "4 segments"}

# ── Sentiment interpolation ──
def _cosine_interp(t, t_start, t_end, v_start, v_end):
    if t <= t_start: return v_start
    if t >= t_end:   return v_end
    progress = (t - t_start) / (t_end - t_start)
    return v_start + (v_end - v_start) * (1 - math.cos(math.pi * progress)) / 2

# ── Entities ──
class AdvertiserEntity(Entity):
    def __init__(self, name="AdPlatform"):
        super().__init__(name)
        self.active_segments = {"core_niche"}
        self.revenue_data = Data()
        self._period_revenue = 0.0

    def handle_event(self, event):
        if event.event_type == "AdClick":
            cpc = event.context.get("cpc", 0.0)
            self._period_revenue += cpc
            self.revenue_data.add_stat(cpc, event.time)
        elif event.event_type == "SegmentControl":
            segment = event.context["segment"]
            if event.context["active"]:
                self.active_segments.add(segment)
            else:
                self.active_segments.discard(segment)

class SellerEntity(Entity):
    def __init__(self, name, advertiser):
        super().__init__(name)
        self._advertiser = advertiser
        self._segment_sales = {s: 0 for s in SEGMENT_NAMES}
        self._segment_revenue = {s: 0.0 for s in SEGMENT_NAMES}
        self._segment_ad_spend = {s: 0.0 for s in SEGMENT_NAMES}
        self._consecutive_loss = {s: 0 for s in SEGMENT_NAMES}
        self._loss_weeks_to_deactivate = 3
        self._cooldown = {s: 0 for s in SEGMENT_NAMES}
        self._cooldown_base = 52
        self._deactivation_count = {s: 0 for s in SEGMENT_NAMES}
        self.sales_data = Data()
        self.revenue_data = Data()
        self.ad_spend_data = Data()
        self.cpa_data = Data()
        self.profit_data = Data()
        self.segment_profit_data = {s: Data() for s in SEGMENT_NAMES}
        self.active_segment_data = Data()

    def start_events(self):
        return [Event(time=Instant.from_seconds(EVAL_INTERVAL), event_type="Evaluate", target=self)]

    def handle_event(self, event):
        if event.event_type == "Sale":
            seg = event.context["segment"]
            self._segment_sales[seg] += 1
            self._segment_revenue[seg] += PRODUCT_PRICE
        elif event.event_type == "AdCost":
            seg = event.context["segment"]
            self._segment_ad_spend[seg] += event.context["cpc"]
        elif event.event_type == "Evaluate":
            return self._evaluate(event)
        return None

    def _evaluate(self, event):
        total_sales = sum(self._segment_sales.values())
        total_revenue = sum(self._segment_revenue.values())
        total_ad_spend = sum(self._segment_ad_spend.values())
        total_profit = total_revenue - total_sales * COGS - total_ad_spend

        self.sales_data.add_stat(total_sales, event.time)
        self.revenue_data.add_stat(total_revenue, event.time)
        self.ad_spend_data.add_stat(total_ad_spend, event.time)
        self.profit_data.add_stat(total_profit, event.time)

        for seg in SEGMENT_NAMES:
            s, r, sp = self._segment_sales[seg], self._segment_revenue[seg], self._segment_ad_spend[seg]
            self.segment_profit_data[seg].add_stat(r - s * COGS - sp, event.time)

        cpa = total_ad_spend / total_sales if total_sales > 0 else 0.0
        self.cpa_data.add_stat(cpa, event.time)

        control_events = []
        for seg in SEGMENT_NAMES:
            if self._cooldown[seg] > 0:
                self._cooldown[seg] -= 1

        for seg in SEGMENT_NAMES:
            sales = self._segment_sales[seg]
            seg_profit = self._segment_revenue[seg] - sales * COGS - self._segment_ad_spend[seg]
            if seg in self._advertiser.active_segments and seg_profit < 0 and sales > 0:
                self._consecutive_loss[seg] += 1
                if self._consecutive_loss[seg] >= self._loss_weeks_to_deactivate:
                    control_events.append(Event(time=event.time, event_type="SegmentControl",
                        target=self._advertiser, context={"segment": seg, "active": False}))
                    self._consecutive_loss[seg] = 0
                    self._deactivation_count[seg] += 1
                    self._cooldown[seg] = self._cooldown_base * (2 ** (self._deactivation_count[seg] - 1))
            else:
                self._consecutive_loss[seg] = 0

        if not control_events and total_profit > 0:
            for seg in SEGMENT_NAMES:
                if seg not in self._advertiser.active_segments and self._cooldown[seg] == 0:
                    control_events.append(Event(time=event.time, event_type="SegmentControl",
                        target=self._advertiser, context={"segment": seg, "active": True}))
                    break

        self.active_segment_data.add_stat(len(self._advertiser.active_segments), event.time)
        self._segment_sales = {s: 0 for s in SEGMENT_NAMES}
        self._segment_revenue = {s: 0.0 for s in SEGMENT_NAMES}
        self._segment_ad_spend = {s: 0.0 for s in SEGMENT_NAMES}
        return control_events + [Event(time=event.time + Duration.from_seconds(EVAL_INTERVAL),
                                       event_type="Evaluate", target=self)]

class Consumer(Entity):
    def __init__(self, cid, segment, base_sentiment, platform, advertiser, seller, rng):
        super().__init__(f"consumer_{cid:04d}")
        self.segment = segment
        self.base_sentiment = base_sentiment
        self.saturation = 0.0
        self._platform = platform
        self._advertiser = advertiser
        self._seller = seller
        self._rng = rng

    def handle_event(self, event):
        if event.event_type != "Visit":
            return None
        self.saturation = max(0.0, self.saturation - SATURATION_DECAY)
        if self.segment not in self._advertiser.active_segments:
            return None
        seg = SEGMENTS[self.segment]
        eff_sentiment = max(0.01, self.base_sentiment + self._platform.global_sentiment_adj)
        sat_mult = 1.0 - self.saturation * 0.5
        self.saturation = min(1.0, self.saturation + SATURATION_INCREASE)
        if self._rng.random() > seg["click_rate"]:
            return None
        cpc = seg["cpc"]
        results = [
            Event(time=event.time, event_type="AdClick", target=self._advertiser,
                  context={"segment": self.segment, "cpc": cpc}),
            Event(time=event.time, event_type="AdCost", target=self._seller,
                  context={"segment": self.segment, "cpc": cpc}),
        ]
        if self._rng.random() <= seg["conv_rate"] * eff_sentiment * sat_mult:
            results.append(Event(time=event.time, event_type="Sale", target=self._seller,
                context={"segment": self.segment, "price": PRODUCT_PRICE, "created_at": event.time}))
        return results

class PlatformEntity(Entity):
    def __init__(self, name, consumers, rng):
        super().__init__(name)
        self._consumers = consumers
        self._rng = rng
        self._global_sentiment_adj = 0.0
        self.sentiment_data = Data()

    @property
    def global_sentiment_adj(self):
        return self._global_sentiment_adj

    def handle_event(self, event):
        if event.event_type == "Visit":
            consumer = self._rng.choice(self._consumers)
            return [Event(time=event.time, event_type="Visit", target=consumer)]
        elif event.event_type == "SentimentAdjust":
            self._global_sentiment_adj = event.context["adjustor"]
            self.sentiment_data.add_stat(self._global_sentiment_adj, event.time)
        return None

# ── Build & run ──
rng = random.Random(SEED)
advertiser = AdvertiserEntity("AdPlatform")
seller = SellerEntity("PosterShop", advertiser)
platform = PlatformEntity("Platform", [], rng)

consumers = []
cid = 0
for seg_name, seg_info in SEGMENTS.items():
    for _ in range(seg_info["size"]):
        consumers.append(Consumer(cid, seg_name, max(0.2, min(1.0, rng.gauss(0.85, 0.10))),
                                  platform, advertiser, seller, rng))
        cid += 1
platform._consumers = consumers

source = Source.poisson(rate=AGGREGATE_VISIT_RATE, target=platform,
                        event_type="Visit", name="Traffic", stop_after=float(DURATION_HOURS))

sim = Simulation(sources=[source], entities=[platform, advertiser, seller, *consumers],
                 duration=DURATION_HOURS + 1)

for e in seller.start_events():
    sim.schedule(e)

step = 12.0
t = 0.1
while t <= DURATION_HOURS:
    if t < SENTIMENT_DECLINE_START:
        adj = 0.0
    elif t > SENTIMENT_DECLINE_END:
        adj = SENTIMENT_DECLINE_TARGET
    else:
        adj = _cosine_interp(t, SENTIMENT_DECLINE_START, SENTIMENT_DECLINE_END, 0.0, SENTIMENT_DECLINE_TARGET)
    sim.schedule(Event(time=Instant.from_seconds(t), event_type="SentimentAdjust",
                       target=platform, context={"adjustor": adj}))
    t += step

sim.run()

# ── Visualization ──
import matplotlib.ticker as mticker

def _add_regime_bg(ax, times, tier_counts, x_max):
    for i in range(len(times)):
        count = int(tier_counts[i])
        color = _REGIME_COLORS.get(count, _REGIME_COLORS[0])
        x_start, x_end = times[i], (times[i + 1] if i + 1 < len(times) else x_max)
        ax.axvspan(x_start, x_end, alpha=0.35, color=color, linewidth=0, zorder=0)

def _fmt_dollars(x, _): return f"${x / 1000:,.1f}k" if abs(x) >= 1000 else f"${x:.1f}"
def _fmt_dollars_k(x, _): return f"${x / 1000:,.1f}k"
def _hours_to_weeks(times): return [t / HOURS_PER_WEEK for t in times]

eval_times = seller.sales_data.times()
eval_weeks = _hours_to_weeks(eval_times)
sales = seller.sales_data.raw_values()
revenues = seller.revenue_data.raw_values()
cpas = seller.cpa_data.raw_values()
profits = seller.profit_data.raw_values()
tier_counts = seller.active_segment_data.raw_values()

seg_colors = {"core_niche": "#4CAF50", "adjacent": "#FF9800", "demographic": "#9C27B0", "broad": "#F44336"}
seg_profits = {s: seller.segment_profit_data[s].raw_values() for s in SEGMENT_NAMES}

sent_weeks = _hours_to_weeks(platform.sentiment_data.times())
mean_eff = [0.85 + v for v in platform.sentiment_data.raw_values()]

# Bucket advertiser revenue into weekly intervals
adv_rev = []
rev_samples = advertiser.revenue_data.values
for i, end_t in enumerate(eval_times):
    start_t = eval_times[i - 1] if i > 0 else 0.0
    adv_rev.append(sum(v for t, v in rev_samples if start_t <= t < end_t))

fig, axes = plt.subplots(6, 1, figsize=(7, 7), sharex=True)
fig.subplots_adjust(hspace=0.35)
fig.suptitle("Adverse Advertising Amplification", fontsize=11, fontweight="bold", y=0.995)

specs = [
    {"t": sent_weeks, "d": mean_eff, "ylabel": "Consumer\nSentiment", "color": "#212121",
     "ylim": (0, 1.1), "fmt": None, "fill": True, "fill_color": "#90CAF9", "regime": False},
    {"t": eval_weeks, "d": sales, "ylabel": "Seller\nSales/wk", "color": "#1976D2",
     "ylim": None, "fmt": "{x:,.0f}", "fill": False, "regime": True},
    {"t": eval_weeks, "d": revenues, "ylabel": "Seller\nRevenue/wk", "color": "#388E3C",
     "ylim": None, "fmt": _fmt_dollars_k, "fill": False, "regime": True},
    {"t": eval_weeks, "d": cpas, "ylabel": "Seller Ad\nSpend/Sale", "color": "#E64A19",
     "ylim": None, "fmt": _fmt_dollars, "fill": False, "regime": True},
    {"t": eval_weeks, "d": profits, "ylabel": "Seller\nProfit/wk", "color": "#0D47A1",
     "ylim": None, "fmt": _fmt_dollars_k, "fill": False, "regime": True,
     "extra": [{"t": eval_weeks, "d": seg_profits[s], "color": seg_colors[s], "label": s} for s in SEGMENT_NAMES]},
    {"t": eval_weeks, "d": adv_rev, "ylabel": "Platform\nRevenue/wk", "color": "#C62828",
     "ylim": None, "fmt": _fmt_dollars_k, "fill": False, "regime": True},
]

for ax, sp in zip(axes, specs):
    if sp["regime"] and eval_weeks and tier_counts:
        _add_regime_bg(ax, eval_weeks, tier_counts, DURATION_WEEKS)
    if sp["t"] and sp["d"]:
        ax.plot(sp["t"], sp["d"], "-", lw=1.8, color=sp["color"], zorder=3, label="Total")
        if sp.get("fill"):
            ax.fill_between(sp["t"], sp["d"], alpha=0.12, color=sp.get("fill_color", sp["color"]), zorder=1)

    all_vals = list(sp["d"]) if sp["d"] else []
    for extra in sp.get("extra", []):
        if extra["t"] and extra["d"]:
            ax.plot(extra["t"], extra["d"], "-", lw=1.0, color=extra["color"], alpha=0.8, zorder=2, label=extra["label"])
            all_vals.extend(extra["d"])
    if sp.get("extra"):
        ax.legend(fontsize=6, loc="upper right", framealpha=0.8, ncol=3)

    ax.set_ylabel(sp["ylabel"], fontsize=8, fontweight="bold")
    if sp["ylim"]:
        ax.set_ylim(sp["ylim"])
    elif all_vals:
        ymax, ymin = max(all_vals), min(all_vals)
        pad = (ymax - ymin) * 0.1 if ymax > ymin else max(abs(ymax) * 0.1, 1)
        ax.set_ylim(min(0, ymin - pad), ymax + pad)
    if sp["fmt"]:
        if callable(sp["fmt"]):
            ax.yaxis.set_major_formatter(mticker.FuncFormatter(sp["fmt"]))
        else:
            ax.yaxis.set_major_formatter(mticker.StrMethodFormatter(sp["fmt"]))
    ax.set_xlim(0, DURATION_WEEKS)
    ax.grid(True, alpha=0.25, zorder=0)
    ax.tick_params(axis="both", labelsize=7)

# Regime legend on top panel
handles = [mpatches.Patch(facecolor=_REGIME_COLORS[n], alpha=0.5, label=_REGIME_LABELS[n])
           for n in range(len(SEGMENT_NAMES), -1, -1)]
axes[0].legend(handles=handles, loc="upper right", fontsize=6, framealpha=0.8, title="Segments")

axes[-1].set_xlabel("Week", fontsize=9, fontweight="bold")
fig.tight_layout(rect=[0, 0, 1, 0.99])
plt.show()
```
Here is a quick summary of what the above graphs demonstrate:
1. **Week 0:** The seller "comes online" at week 0 and quickly expands while consumer sentiment is high.
2. **Week 10:** Consumer sentiment drops, and the broadest advertising campaigns start losing money (see Seller Profit/wk)
3. **Week 13-16:** The seller notices the losses, and scales down their operation back to the original niche.
4. As a result of the shift in consumer sentiment, seller weekly profit drops from ~3.5 to ~1.5k, roughly a 60% decline, but platform revenue drops from 1.6k to 0.15k, a 90% decline - an amplification!
This is a toy model, but there is some interesting work on behavioral simulation happening at [Simile AI](https://www.simile.ai/) if you are interested in behavioural modelling like I am. Their work on generative agent simulations [[5]](#references) [[6]](#references) shows how LLM-driven agents can replicate real human survey responses and social behaviours at scale.
## References
[1] Wikipedia, "Pay-per-click" - [Wikipedia](https://en.wikipedia.org/wiki/Pay-per-click)
[2] Varian, H.R., "Position Auctions" (2007) - [PDF](https://people.ischool.berkeley.edu/~hal/Papers/2006/position.pdf)
[3] Wikipedia, "Operating leverage" - [Wikipedia](https://en.wikipedia.org/wiki/Operating_leverage)
[4] Wikipedia, "Discrete-event simulation" - [Wikipedia](https://en.wikipedia.org/wiki/Discrete-event_simulation)
[5] Park, J.S. et al., "Generative Agent Simulations of 1,000 People" (2024) - [arXiv](https://arxiv.org/abs/2411.10109)
[6] Park, J.S. et al., "Generative Agents: Interactive Simulacra of Human Behavior" (2023) - [arXiv](https://arxiv.org/abs/2304.03442)