
Modeling Cold Starts
simulation
distributed
caching
python
Using simulation to understand cache warmup behavior.
I was once asked to model the “cache cold start” behavior of a deep service-oriented architecture with multiple cache layers to figure out our resilience to such a scenario.
Caches are famously good at improving system performance, and infamously good at hiding capacity issues. Your system may operate well in steady state, and you may have never even seen your system operating in any other state, but it’s worth knowing if your system can function at all if caches were to suddenly invalidate due to a total network outage lasting your TTL or some other “on-off-on” style outage.
To complete this task, I dove into logs at each layer to determine per-second request rates and traffic distributions. After collecting this data and combining it with cache parameters, I built a model of what was likely to happen. It was laborious, tedious, and unlikely to be re-performed on a regular basis.
I’ve been working on a discrete simulation library [1] to help with these types of analysis tasks. You plug in your system’s known parameters (cache size, cache TTL, eviction policy, network delays, server concurrency, etc.), do some analysis to understand the customer traffic pattern (i.e. Zipf distributions [2] are common here), and get useful insights into the load at various parts of the system.
The sky is the limit for complexity. I simulated a simple client-cache-datastore as a demonstration:
Simulation
Requests arrive following a Poisson process at 1000 requests/second, with customer IDs drawn from a Zipf distribution (modeling the “hot customer” phenomenon where a small number of customers generate most traffic). The server maintains an LRU cache of 150 entries. On cache miss, it fetches from the datastore Probes sample the cache hit rate, datastore read count, and client latency every 100ms.
Show simulation code
from __future__ import annotations

import random
from collections import defaultdict
from dataclasses import dataclass
from typing import Generator

import matplotlib.pyplot as plt
import numpy as np

from happysimulator import (
    ConstantRateProfile,
    Data,
    Entity,
    Event,
    FIFOQueue,
    Instant,
    PoissonArrivalTimeProvider,
    Probe,
    QueuedResource,
    Simulation,
    Source,
    DistributedFieldProvider,
    ZipfDistribution,
)
from happysimulator.components.datastore import (
    CachedStore,
    KVStore,
    LRUEviction,
)


@dataclass(frozen=True)
class ColdStartConfig:
    """Configuration for cold start simulation."""
    arrival_rate: float = 1000.0
    num_customers: int = 200
    zipf_s: float = 1.5
    cache_capacity: int = 150
    cache_read_latency_s: float = 0.0001
    ingress_latency_s: float = 0.010
    db_network_latency_s: float = 0.010
    datastore_read_latency_s: float = 0.001
    cold_start_time_s: float = 60.0
    duration_s: float = 120.0
    seed: int = 42


class CachedServer(QueuedResource):
    """Server with local cache backed by remote datastore."""

    def __init__(self, name: str, *, datastore: KVStore, cache_capacity: int,
                 cache_read_latency_s: float, ingress_latency_s: float,
                 downstream: Entity | None = None):
        super().__init__(name, policy=FIFOQueue())
        self.downstream = downstream
        self._ingress_latency_s = ingress_latency_s
        self._datastore = datastore
        self._cache = CachedStore(
            name=f"{name}_cache", backing_store=datastore,
            cache_capacity=cache_capacity, eviction_policy=LRUEviction(),
            cache_read_latency=cache_read_latency_s, write_through=True,
        )
        self._last_cache_hits = 0
        self._last_cache_misses = 0

    @property
    def hit_rate(self) -> float:
        hits = self._cache.stats.hits - self._last_cache_hits
        misses = self._cache.stats.misses - self._last_cache_misses
        total = hits + misses
        return hits / total if total > 0 else 0.0

    @property
    def datastore_reads(self) -> int:
        return self._datastore.stats.reads

    def reset_cache(self) -> None:
        self._cache.invalidate_all()
        self._last_cache_hits = self._cache.stats.hits
        self._last_cache_misses = self._cache.stats.misses

    def handle_queued_event(self, event: Event) -> Generator[float, None, list[Event]]:
        yield self._ingress_latency_s
        customer_id = event.context.get("customer_id", 0)
        _ = yield from self._cache.get(f"customer:{customer_id}")
        yield 0.001
        if self.downstream is None:
            return []
        return [Event(time=self.now, event_type="Response", target=self.downstream,
                      context=event.context)]


class LatencySink(Entity):
    """Sink that records end-to-end latency."""

    def __init__(self, name: str):
        super().__init__(name)
        self.latencies_s: list[float] = []
        self.completion_times: list[Instant] = []

    def handle_event(self, event: Event) -> list[Event]:
        created_at: Instant = event.context.get("created_at", event.time)
        self.latencies_s.append((event.time - created_at).to_seconds())
        self.completion_times.append(event.time)
        return []


# Run simulation
random.seed(42)
config = ColdStartConfig()

datastore = KVStore(
    name="Datastore",
    read_latency=config.db_network_latency_s + config.datastore_read_latency_s,
    write_latency=config.db_network_latency_s + config.datastore_read_latency_s,
)

for cid in range(config.num_customers):
    datastore.put_sync(f"customer:{cid}", {"id": cid})

sink = LatencySink(name="Sink")
server = CachedServer(
    name="Server", datastore=datastore, cache_capacity=config.cache_capacity,
    cache_read_latency_s=config.cache_read_latency_s,
    ingress_latency_s=config.ingress_latency_s, downstream=sink,
)

customer_dist = ZipfDistribution(list(range(config.num_customers)), s=config.zipf_s, seed=config.seed)
provider = DistributedFieldProvider(
    target=server, event_type="Request",
    field_distributions={"customer_id": customer_dist},
    stop_after=Instant.from_seconds(config.duration_s),
)
arrival = PoissonArrivalTimeProvider(
    ConstantRateProfile(rate=config.arrival_rate), start_time=Instant.Epoch
)
source = Source(name="Source", event_provider=provider, arrival_time_provider=arrival)

# Probes
hit_rate_data, datastore_reads_data = Data(), Data()
probes = [
    Probe(target=server, metric="hit_rate", data=hit_rate_data, interval=0.1, start_time=Instant.Epoch),
    Probe(target=server, metric="datastore_reads", data=datastore_reads_data, interval=0.1, start_time=Instant.Epoch),
]

# Cache reset event
def reset_callback(_e: Event) -> list[Event]:
    server.reset_cache()
    return []

reset_event = Event.once(
    time=Instant.from_seconds(config.cold_start_time_s),
    event_type="CacheReset", fn=reset_callback,
)

sim = Simulation(
    start_time=Instant.Epoch, end_time=Instant.from_seconds(config.duration_s + 5.0),
    sources=[source], entities=[datastore, server, sink], probes=probes,
)
sim.schedule(reset_event)
sim.run()
SimulationSummary(duration_s=125.000582313, total_events_processed=1329602, events_cancelled=0, events_per_second=10636.766448580953, wall_clock_seconds=13.093869135999967, entities={'Datastore': EntitySummary(name='Datastore', entity_type='KVStore', events_handled=0, queue_stats=None), 'Server': EntitySummary(name='Server', entity_type='CachedServer', events_handled=0, queue_stats=QueueStats(peak_depth=0, total_accepted=119965, total_dropped=0)), 'Sink': EntitySummary(name='Sink', entity_type='LatencySink', events_handled=0, queue_stats=None)})Results
Show visualization code
# Extract data
hr_times = [t for t, _ in hit_rate_data.values]
hr_values = [v for _, v in hit_rate_data.values]

# Compute datastore read rate
dr_values = datastore_reads_data.values
dr_rate_times, dr_rate_values = [], []
for i in range(1, len(dr_values)):
    t_prev, reads_prev = dr_values[i - 1]
    t_curr, reads_curr = dr_values[i]
    dt = t_curr - t_prev
    if dt > 0:
        dr_rate_times.append(t_curr)
        dr_rate_values.append((reads_curr - reads_prev) / dt)

# Bucket latencies
def bucket_latencies(times_s, latencies_s, bucket_size_s=1.0):
    buckets = defaultdict(list)
    for t, lat in zip(times_s, latencies_s):
        buckets[int(t / bucket_size_s)].append(lat)
    result = {"time_s": [], "avg": []}
    for bucket in sorted(buckets.keys()):
        result["time_s"].append(bucket * bucket_size_s)
        result["avg"].append(sum(buckets[bucket]) / len(buckets[bucket]))
    return result

times_s = [t.to_seconds() for t in sink.completion_times]
latency_buckets = bucket_latencies(times_s, sink.latencies_s)

# Helper to plot charts horizontally
def plot_charts(axes, xlim=None):
    ax = axes[0]
    ax.plot(hr_times, hr_values, "g-", linewidth=1.5)
    ax.axvline(x=reset_time, color="purple", linestyle="--", alpha=0.7, label="Reset")
    ax.set_xlabel("Time (s)")
    ax.set_ylabel("Hit Rate")
    ax.set_title("Cache Hit Rate", fontsize=9)
    ax.set_ylim(0, 1.05)
    if xlim:
        ax.set_xlim(xlim)
    ax.legend(fontsize=6, loc="lower right")
    ax.grid(True, alpha=0.3)
    ax.tick_params(labelsize=7)

    ax = axes[1]
    ax.plot(dr_rate_times, dr_rate_values, "orange", linewidth=1.5)
    ax.axvline(x=reset_time, color="purple", linestyle="--", alpha=0.7, label="Reset")
    ax.set_xlabel("Time (s)")
    ax.set_ylabel("Reads/s")
    ax.set_title("Datastore Read Rate", fontsize=9)
    if xlim:
        ax.set_xlim(xlim)
    ax.legend(fontsize=6, loc="upper right")
    ax.grid(True, alpha=0.3)
    ax.tick_params(labelsize=7)

    ax = axes[2]
    if latency_buckets["time_s"]:
        avg_ms = [v * 1000 for v in latency_buckets["avg"]]
        ax.plot(latency_buckets["time_s"], avg_ms, "b-", linewidth=1.5)
    ax.axvline(x=reset_time, color="purple", linestyle="--", alpha=0.7, label="Reset")
    ax.set_xlabel("Time (s)")
    ax.set_ylabel("Latency (ms)")
    ax.set_title("Client Latency", fontsize=9)
    if xlim:
        ax.set_xlim(xlim)
    ax.legend(fontsize=6, loc="upper right")
    ax.grid(True, alpha=0.3)
    ax.tick_params(labelsize=7)

reset_time = config.cold_start_time_s

# Full timeline - horizontal layout
fig, axes = plt.subplots(1, 3, figsize=(7, 2.2))
plot_charts(axes)
fig.suptitle("Full Simulation", fontsize=10)
plt.tight_layout()
plt.show()

# Zoomed view: 10 seconds around the cold start
fig, axes = plt.subplots(1, 3, figsize=(7, 2.2))
zoom_xlim = (reset_time - 5, reset_time + 5)
plot_charts(axes, xlim=zoom_xlim)
fig.suptitle(f"Zoomed: t={reset_time-5:.0f}s to t={reset_time+5:.0f}s", fontsize=10)
plt.tight_layout()
plt.show()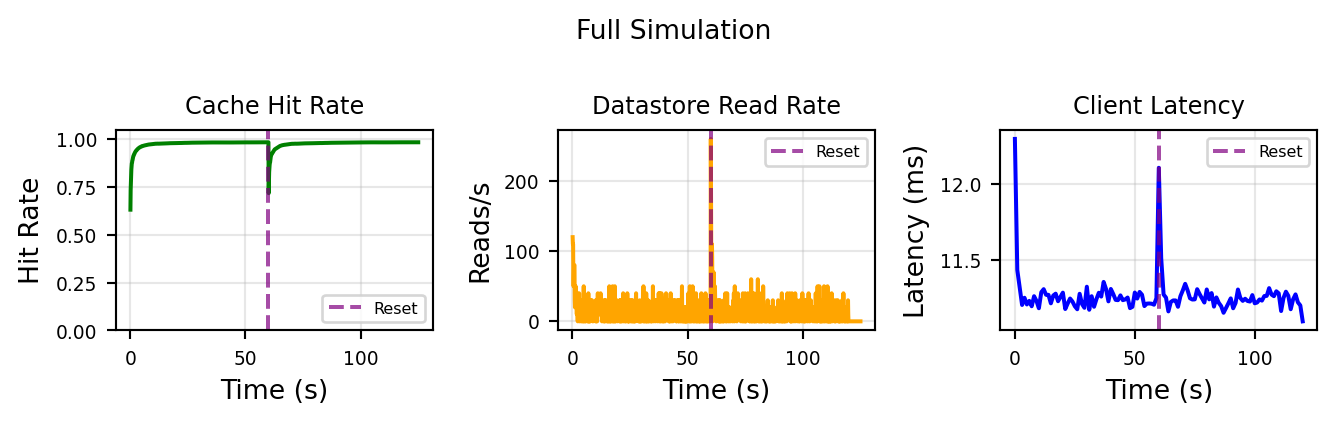
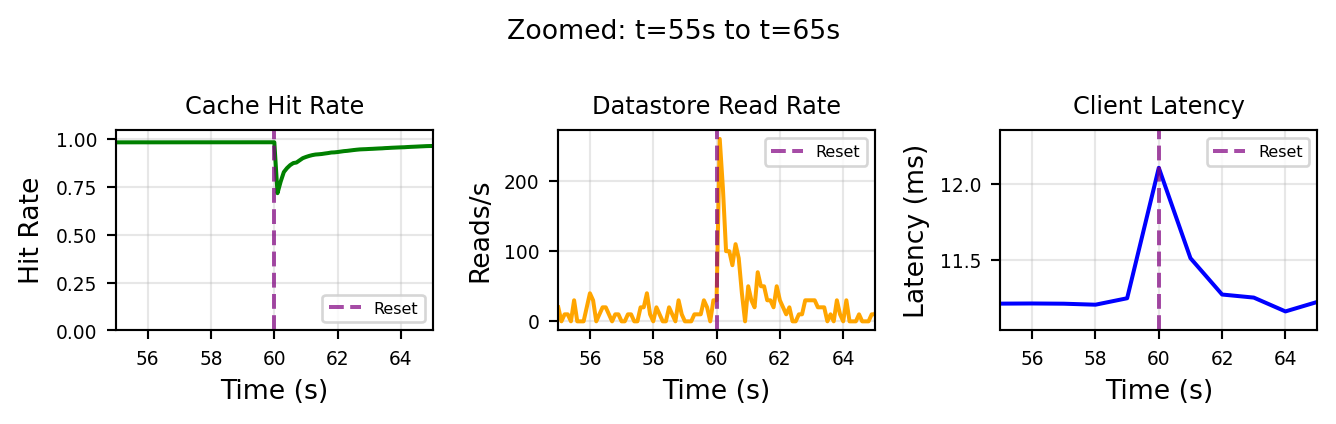
The cache cold start (purple dashed line) is the interesting bit here. The simulation purges the cache and so the system operates in “cold start” regime for a few seconds. The most notable impact is the datastore read rate, unsurprisingly the load increases ~30 fold as the cache needs to re-hydrate.
This isn’t that surprising, but deriving the magnitude of these load spikes in a multi-layered architecture can be difficult task if done analytically (and it will be taken with a large grain of salt), so it’s best to run a quick simulation.
Once you know the maximum expected load, you can decide whether you want to provision accordingly or at least ensure that you can preserve goodput at this load and prevent a metastable failure [4].
In a future post, I’ll build a more complicated architecture, and demonstrate how a cold-cache (or even a suboptimal cache) can trigger a full system collapse via congestive collapse.
References
- Fillion, Adam. “happy-simulator.” GitHub.
- “Zipf’s law.” Wikipedia.
- “Cache replacement policies.” Wikipedia.
- Bronson, Nathan et al. “Metastable failures in distributed systems.” HotOS 2021.