---
title: "Simulation Enhanced Reasoning"
description: "Using simulations to model distributed system behavior."
author: "Adam Fillion"
date: "2026-01-25"
categories: [simulation, distributed-systems, python, load-balancing]
draft: false
format:
html:
code-fold: true
---
Simulation can be valuable when there is a heavy cost to setting up or changing a system that's also impractical to model analytically.
In these cases, you can simulate the system and make observations without the resources or mathematical brilliance needed for actual reproductions or analytical solutions, respectively.
The software industry has been slow to adopt this technique, mainly because code is cheap (free?) and easy to modify.
However, code deployed to thousands of machines connected by a network becomes less about the code and more about emergent properties of the distributed organism. At this scale, the system is expensive to set up or modify, and it's usually not practical to analytically "solve" it.
One obstacle to adoption is the sheer toil involved in accurately modeling a system at whichever abstraction layer the analysis requires.
However, with the help of [libraries](https://github.com/adamfilli/happy-simulator/tree/main/happysimulator) and AI coding tools to automate the boiler plate - most of this friction can be eliminated.
I was recently asked about an intelligent routing design in a service that aimed to avoid overloaded backend servers. The design required parameter tuning that is dependent on real traffic patterns and client and server counts.
This is a great use case for simulation, since analytical solutions are hard to come by (and treated with skepticism), and tuning parameters in production is a very slow process due to safety and risk requirements.
The desired functionality is shown in the below diagram. Customer 1001 overloads Server 2, and the clients detect this and rebalance the load to the other servers.
```{ojs}
//| echo: false
{
  const width = 720, height = 260;
  const panelWidth = 340;
  const svg = d3.create("svg").attr("viewBox", [0, 0, width, height]).attr("width", "100%");

  // Draw a single panel
  const drawPanel = (offsetX, title, subtitle, serverLoads, highlightServer2, subtitleColor) => {
    const sourceX = offsetX + 35, routerX = offsetX + 100, clientX = offsetX + 190, serverX = offsetX + 295;
    const topY = 70, midY = 130, botY = 190;
    const clientYs = [topY, midY, botY];
    const serverYs = [topY, midY, botY];

    // Panel title
    svg.append("text").attr("x", offsetX + panelWidth/2).attr("y", 22).attr("text-anchor", "middle")
      .attr("font-size", "11px").attr("font-weight", "bold").text(title);
    svg.append("text").attr("x", offsetX + panelWidth/2).attr("y", 38).attr("text-anchor", "middle")
      .attr("font-size", "9px").attr("fill", subtitleColor).text(subtitle);

    // Helper: draw a box
    const drawBox = (x, y, w, h, label, color) => {
      svg.append("rect").attr("x", x - w/2).attr("y", y - h/2)
        .attr("width", w).attr("height", h)
        .attr("fill", color).attr("stroke", "#333").attr("stroke-width", 1).attr("rx", 3);
      svg.append("text").attr("x", x).attr("y", y + 3).attr("text-anchor", "middle")
        .attr("font-size", "8px").attr("font-weight", "bold").text(label);
    };

    // Sources
    drawBox(sourceX, topY, 50, 28, "0-999", "#a8e6cf");
    drawBox(sourceX, botY, 50, 28, "1001", highlightServer2 ? "#ffcccc" : "#ffd3b6");

    // Router
    drawBox(routerX, midY, 45, 32, "Router", "#dcedc1");

    // Clients
    drawBox(clientX, topY, 45, 26, "Client 0", "#c9d6ea");
    drawBox(clientX, midY, 45, 26, "Client 1", "#c9d6ea");
    drawBox(clientX, botY, 45, 26, "Client 2", "#c9d6ea");

    // Servers with load bars
    const serverColors = serverLoads.map(l => l > 0.9 ? "#e74c3c" : l > 0.6 ? "#f39c12" : "#27ae60");
    serverYs.forEach((y, i) => {
      const load = serverLoads[i];
      const color = serverColors[i];
      svg.append("rect").attr("x", serverX - 28).attr("y", y - 16).attr("width", 56).attr("height", 32)
        .attr("fill", "#f5f5f5").attr("stroke", "#333").attr("stroke-width", 1).attr("rx", 3);
      svg.append("rect").attr("x", serverX - 24).attr("y", y + 4).attr("width", 48).attr("height", 8)
        .attr("fill", "#ddd").attr("rx", 2);
      svg.append("rect").attr("x", serverX - 24).attr("y", y + 4).attr("width", Math.min(48, 48 * load)).attr("height", 8)
        .attr("fill", color).attr("rx", 2);
      svg.append("text").attr("x", serverX).attr("y", y - 2).attr("text-anchor", "middle")
        .attr("font-size", "8px").attr("font-weight", "bold").text(`S${i}`);
    });

    // Arrow helper
    const arrow = (x1, y1, x2, y2, intensity, color) => {
      svg.append("line").attr("x1", x1).attr("y1", y1).attr("x2", x2).attr("y2", y2)
        .attr("stroke", color).attr("stroke-width", 0.8 + intensity).attr("opacity", 0.3 + 0.7 * intensity)
        .attr("marker-end", "url(#arr)");
    };

    // Source -> Router
    arrow(sourceX + 25, topY, routerX - 22, midY - 8, 0.3, "#666");
    arrow(sourceX + 25, botY, routerX - 22, midY + 8, highlightServer2 ? 0.8 : 0.3, highlightServer2 ? "#e74c3c" : "#666");

    // Router -> Clients
    arrow(routerX + 22, midY - 6, clientX - 22, topY + 2, 0.3, "#666");
    arrow(routerX + 22, midY, clientX - 22, midY, 0.3, "#666");
    arrow(routerX + 22, midY + 6, clientX - 22, botY - 2, 0.3, "#666");

    // Clients -> Servers (each client to all servers)
    clientYs.forEach((clientY) => {
      serverYs.forEach((serverY, serverIdx) => {
        let intensity = highlightServer2 ? (serverIdx === 2 ? 0.6 : 0.1) : 0.35;
        let color = highlightServer2 && serverIdx === 2 ? "#e74c3c" : "#888";
        arrow(clientX + 22, clientY, serverX - 28, serverY, intensity, color);
      });
    });
  };

  // Arrowhead marker
  svg.append("defs").append("marker").attr("id", "arr").attr("markerWidth", 6).attr("markerHeight", 5)
    .attr("refX", 5).attr("refY", 2.5).attr("orient", "auto")
    .append("polygon").attr("points", "0 0, 6 2.5, 0 5").attr("fill", "#666");

  // Separator line
  svg.append("line").attr("x1", panelWidth + 10).attr("y1", 15).attr("x2", panelWidth + 10).attr("y2", height - 30)
    .attr("stroke", "#ccc").attr("stroke-width", 1).attr("stroke-dasharray", "4,4");

  // Left panel: Before smart routing (spike, server 2 overloaded)
  drawPanel(5, "Before Smart Routing", "Server 2 saturated", [0.3, 0.3, 1.2], true, "#e74c3c");

  // Right panel: After smart routing (load balanced)
  drawPanel(panelWidth + 25, "After Smart Routing", "Load redistributed via rehashing", [0.55, 0.6, 0.55], false, "#27ae60");

  // Legend
  const legendY = height - 18;
  svg.append("circle").attr("cx", 200).attr("cy", legendY).attr("r", 4).attr("fill", "#27ae60");
  svg.append("text").attr("x", 208).attr("y", legendY + 3).attr("font-size", "8px").text("< 60%");
  svg.append("circle").attr("cx", 260).attr("cy", legendY).attr("r", 4).attr("fill", "#f39c12");
  svg.append("text").attr("x", 268).attr("y", legendY + 3).attr("font-size", "8px").text("60-90%");
  svg.append("circle").attr("cx", 330).attr("cy", legendY).attr("r", 4).attr("fill", "#e74c3c");
  svg.append("text").attr("x", 338).attr("y", legendY + 3).attr("font-size", "8px").text("> 90%");

  return svg.node();
}
```
```{ojs}
//| echo: false
d3 = require("d3@7")
```
The implementation works as follows: each server reports its current load (in-flight requests / concurrency) in every response. Clients track these load reports in a 4-second sliding window. When routing a request, the client first tries the deterministic hash-based server (`hash(customer_id) % num_servers`). If that server's average load exceeds 90%, the client rehashes with a random salt to find a less loaded server.
Based on this implementation, we can create a simulation with a simple prompt and run the simulation to generate results.
::: {.callout-note collapse="true"}
## Prompt used to generate this simulation, Happy-Simulator repo as context, no system prompt, minor follow up tweaks
I want to build an example which simulates the convergence time of a load aware routing mechanism. For this example, we will have 3 servers, 3 clients, and an event source representing random customers from 0-1000 that sends events to a router which routes events according to the hash of customerID to one of the 3 clients. We then will have another event source representing customer 1001 which will send requests to the same router and events will also be hashed and routed. The event source for customer 1001 will produce events at a much higher rate, which should saturate whichever server is assigned to serving them.
After this is implemented, we need to complicate the simulation a bit in order to implement smart rerouting. Servers should respond to clients with a successful response that also reports their load from 0 to 1. Clients should maintain internal state about recent server load over the last N seconds (configurable), and if they detect that a server load is > 0.9 they should rehash the request until they get a different server to send it to.
:::
```{python}
#| code-fold: true
from __future__ import annotations

import random
from collections import defaultdict, deque
from dataclasses import dataclass
from typing import Generator

import matplotlib.pyplot as plt
import numpy as np

from happysimulator import (
    ConstantArrivalTimeProvider,
    ConstantRateProfile,
    Data,
    Duration,
    Entity,
    Event,
    EventProvider,
    FIFOQueue,
    Instant,
    PoissonArrivalTimeProvider,
    Probe,
    QueuedResource,
    RandomRouter,
    Simulation,
    Source,
    SpikeProfile,
)


# =============================================================================
# Load Reporting Server
# =============================================================================


class LoadReportingServer(QueuedResource):
    """A queued server that reports its load in responses."""

    def __init__(
        self,
        name: str,
        *,
        server_id: int,
        concurrency: int = 10,
        mean_service_time_s: float = 0.1,
        max_queue_depth: int = 100,
    ):
        super().__init__(name, policy=FIFOQueue())
        self.server_id = server_id
        self.concurrency = concurrency
        self.mean_service_time_s = mean_service_time_s
        self.max_queue_depth = max_queue_depth
        self._in_flight: int = 0
        self.stats_processed: int = 0
        self.stats_rejected: int = 0
        self.completion_times: list[Instant] = []
        self.service_times_s: list[float] = []

    @property
    def load(self) -> float:
        return self._in_flight / self.concurrency

    def has_capacity(self) -> bool:
        return self._in_flight < self.concurrency

    def handle_event(self, event: Event) -> list[Event]:
        # Check if queue is at max depth - reject with 100% load
        if self.depth >= self.max_queue_depth:
            self.stats_rejected += 1
            client: Entity | None = event.context.get("client")
            if client is None:
                return []
            # Return failure response with 100% load
            response = Event(
                time=self.now,
                event_type="Response",
                target=client,
                context={
                    "server_id": self.server_id,
                    "server_load": 1.0,  # Report 100% load when rejecting
                    "customer_id": event.context.get("customer_id"),
                    "created_at": event.context.get("created_at"),
                    "rejected": True,
                },
            )
            return [response]
        # Otherwise, let the parent class handle queueing
        return super().handle_event(event)

    def handle_queued_event(self, event: Event) -> Generator[float, None, list[Event]]:
        self._in_flight += 1
        service_time = random.expovariate(1.0 / self.mean_service_time_s)
        yield service_time, None
        self._in_flight -= 1
        self.stats_processed += 1
        self.completion_times.append(self.now)
        self.service_times_s.append(service_time)

        client: Entity | None = event.context.get("client")
        if client is None:
            return []

        response = Event(
            time=self.now,
            event_type="Response",
            target=client,
            context={
                "server_id": self.server_id,
                "server_load": self.load,
                "customer_id": event.context.get("customer_id"),
                "created_at": event.context.get("created_at"),
            },
        )
        return [response]


# =============================================================================
# Load-Aware Client
# =============================================================================


@dataclass
class LoadSample:
    time: Instant
    load: float


class LoadAwareClient(Entity):
    """Thick client with hash-based routing and smart load avoidance."""

    def __init__(
        self,
        name: str,
        *,
        client_id: int,
        servers: list[Entity],
        load_window_s: float = 5.0,
        load_threshold: float = 0.9,
        enable_smart_routing: bool = True,
    ):
        super().__init__(name)
        self.client_id = client_id
        self.servers = servers
        self.load_window_s = load_window_s
        self.load_threshold = load_threshold
        self.enable_smart_routing = enable_smart_routing
        self._server_loads: dict[int, deque[LoadSample]] = defaultdict(deque)
        self.stats_requests: int = 0
        self.stats_responses: int = 0
        self.stats_rehashes: int = 0
        self.completion_times: list[Instant] = []
        self.latencies_s: list[float] = []
        self.customer_ids: list[int] = []
        self.server_choices: list[int] = []
        self.routing_times: list[Instant] = []
        self.routing_decisions: list[tuple[int, int]] = []
        self.perceived_server2_times: list[Instant] = []
        self.perceived_server2_loads: list[float] = []

    def handle_event(self, event: Event) -> list[Event]:
        if event.event_type == "Request":
            return self._handle_request(event)
        elif event.event_type == "Response":
            return self._handle_response(event)
        return []

    def _handle_request(self, event: Event) -> list[Event]:
        self.stats_requests += 1
        customer_id = event.context.get("customer_id", 0)
        server_idx = self._select_server(customer_id)
        self.routing_times.append(self.now)
        self.routing_decisions.append((customer_id, server_idx))

        server_request = Event(
            time=self.now,
            event_type="Request",
            target=self.servers[server_idx],
            context={
                "customer_id": customer_id,
                "created_at": event.context.get("created_at", self.now),
                "client": self,
            },
        )
        return [server_request]

    def _handle_response(self, event: Event) -> list[Event]:
        self.stats_responses += 1
        server_id = event.context.get("server_id", 0)
        server_load = event.context.get("server_load", 0.0)
        self._server_loads[server_id].append(LoadSample(self.now, server_load))

        created_at: Instant = event.context.get("created_at", event.time)
        latency_s = (event.time - created_at).to_seconds()
        self.completion_times.append(event.time)
        self.latencies_s.append(latency_s)
        self.customer_ids.append(event.context.get("customer_id", 0))
        self.server_choices.append(server_id)
        return []

    def _select_server(self, customer_id: int) -> int:
        num_servers = len(self.servers)
        base_idx = hash(customer_id) % num_servers

        if not self.enable_smart_routing:
            return base_idx

        cutoff = self.now - Duration.from_seconds(self.load_window_s)
        for server_id, samples in self._server_loads.items():
            while samples and samples[0].time < cutoff:
                samples.popleft()

        # Track perceived load for Server 2
        server2_samples = self._server_loads.get(2)
        perceived_load = sum(s.load for s in server2_samples) / len(server2_samples) if server2_samples else 0.0
        self.perceived_server2_times.append(self.now)
        self.perceived_server2_loads.append(perceived_load)

        # Try the base hash first
        samples = self._server_loads.get(base_idx)
        recent_load = sum(s.load for s in samples) / len(samples) if samples else 0.0

        if recent_load < self.load_threshold:
            return base_idx

        # Base server is overloaded - try random rehashing
        for attempt in range(num_servers):
            salt = random.randint(0, 1000000)
            idx = hash((customer_id, salt)) % num_servers
            samples = self._server_loads.get(idx)
            recent_load = sum(s.load for s in samples) / len(samples) if samples else 0.0

            if recent_load < self.load_threshold:
                self.stats_rehashes += 1
                return idx

        return base_idx


# =============================================================================
# Event Providers
# =============================================================================


class RandomCustomerProvider(EventProvider):
    def __init__(self, target: Entity, *, stop_after: Instant | None = None):
        self._target = target
        self._stop_after = stop_after
        self.generated: int = 0

    def get_events(self, time: Instant) -> list[Event]:
        if self._stop_after is not None and time > self._stop_after:
            return []
        self.generated += 1
        return [Event(
            time=time,
            event_type="Request",
            target=self._target,
            context={"customer_id": random.randint(0, 999), "created_at": time},
        )]


class HighRateCustomerProvider(EventProvider):
    def __init__(self, target: Entity, *, customer_id: int = 1001, stop_after: Instant | None = None):
        self._target = target
        self._customer_id = customer_id
        self._stop_after = stop_after
        self.generated: int = 0

    def get_events(self, time: Instant) -> list[Event]:
        if self._stop_after is not None and time > self._stop_after:
            return []
        self.generated += 1
        return [Event(
            time=time,
            event_type="Request",
            target=self._target,
            context={"customer_id": self._customer_id, "created_at": time},
        )]


# =============================================================================
# Run the Simulation
# =============================================================================

random.seed(42)

# Configuration
NUM_SERVERS = 3
NUM_CLIENTS = 3
DURATION_S = 60.0
SPIKE_WARMUP_S = 10.0
SPIKE_DURATION_S = 15.0

# Create servers
servers = [
    LoadReportingServer(f"Server{i}", server_id=i, concurrency=10, mean_service_time_s=0.1, max_queue_depth=100)
    for i in range(NUM_SERVERS)
]

# Create clients
clients = [
    LoadAwareClient(f"Client{i}", client_id=i, servers=servers, load_window_s=4.0,
                    load_threshold=0.9, enable_smart_routing=True)
    for i in range(NUM_CLIENTS)
]

# Create router
router = RandomRouter(name="Router", targets=clients)

# Create probes
server_depth_data = [Data() for _ in range(NUM_SERVERS)]
server_load_data = [Data() for _ in range(NUM_SERVERS)]

probes = []
for i, server in enumerate(servers):
    probes.append(Probe(target=server, metric="depth", data=server_depth_data[i],
                        interval=0.1, start_time=Instant.Epoch))
    probes.append(Probe(target=server, metric="load", data=server_load_data[i],
                        interval=0.1, start_time=Instant.Epoch))

# Create sources
stop_after = Instant.from_seconds(DURATION_S)

random_provider = RandomCustomerProvider(router, stop_after=stop_after)
random_source = Source(
    name="RandomSource",
    event_provider=random_provider,
    arrival_time_provider=ConstantArrivalTimeProvider(
        ConstantRateProfile(rate=20.0), start_time=Instant.Epoch
    ),
)

spike_profile = SpikeProfile(
    baseline_rate=10.0, spike_rate=150.0,
    warmup_s=SPIKE_WARMUP_S, spike_duration_s=SPIKE_DURATION_S
)
high_rate_provider = HighRateCustomerProvider(router, stop_after=stop_after)
high_rate_source = Source(
    name="HighRateSource",
    event_provider=high_rate_provider,
    arrival_time_provider=PoissonArrivalTimeProvider(spike_profile, start_time=Instant.Epoch),
)

# Run simulation
sim = Simulation(
    start_time=Instant.Epoch,
    end_time=Instant.from_seconds(DURATION_S + 5.0),
    sources=[random_source, high_rate_source],
    entities=[router] + clients + servers,
    probes=probes,
)
sim.run()


# =============================================================================
# Visualization
# =============================================================================

spike_start = SPIKE_WARMUP_S
spike_end = SPIKE_WARMUP_S + SPIKE_DURATION_S

def add_spike_shading(ax):
    ax.axvspan(spike_start, spike_end, alpha=0.15, color="red")
    ax.axvline(spike_start, color="red", linestyle=":", alpha=0.5)
    ax.axvline(spike_end, color="red", linestyle=":", alpha=0.5)

# Prepare latency data
all_times_s, all_latencies_s, all_customer_ids = [], [], []
for client in clients:
    for t, lat, cid in zip(client.completion_times, client.latencies_s, client.customer_ids):
        all_times_s.append(t.to_seconds())
        all_latencies_s.append(lat)
        all_customer_ids.append(cid)

random_buckets, hr_buckets = defaultdict(list), defaultdict(list)
for t, lat, cid in zip(all_times_s, all_latencies_s, all_customer_ids):
    (hr_buckets if cid == 1001 else random_buckets)[int(t)].append(lat)

random_lats = [lat*1000 for lat, cid in zip(all_latencies_s, all_customer_ids) if cid != 1001]
hr_lats = [lat*1000 for lat, cid in zip(all_latencies_s, all_customer_ids) if cid == 1001]

# --- Figure 1: Queue Depth and Server Load ---
fig, axes = plt.subplots(1, 2, figsize=(8, 3))

ax = axes[0]
for i in range(NUM_SERVERS):
    times = [t for t, _ in server_depth_data[i].values]
    depths = [v for _, v in server_depth_data[i].values]
    ax.plot(times, depths, label=f"Server{i}", alpha=0.8)
add_spike_shading(ax)
ax.set_xlabel("Time (s)")
ax.set_ylabel("Queue Depth")
ax.set_title("Server Queue Depths")
ax.legend(fontsize=8)
ax.grid(True, alpha=0.3)

ax = axes[1]
for i in range(NUM_SERVERS):
    times = [t for t, _ in server_load_data[i].values]
    loads = [v for _, v in server_load_data[i].values]
    ax.plot(times, loads, label=f"Server{i}", alpha=0.8)
ax.axhline(y=0.9, color="orange", linestyle="--", alpha=0.7, label="Threshold")
add_spike_shading(ax)
ax.set_xlabel("Time (s)")
ax.set_ylabel("Load")
ax.set_title("Server Load")
ax.legend(fontsize=8)
ax.grid(True, alpha=0.3)

plt.tight_layout()
plt.show()

# --- Figure 2: Actual vs Perceived Server 2 Load ---
fig, ax = plt.subplots(figsize=(8, 3))

# Actual Server 2 load
times_actual = [t for t, _ in server_load_data[2].values]
loads_actual = [v for _, v in server_load_data[2].values]
ax.plot(times_actual, loads_actual, "b-", label="Server 2 Actual Load", alpha=0.8, linewidth=1.5)

# Aggregate perceived load from all clients (average by time bucket)
perceived_buckets = defaultdict(list)
for client in clients:
    for t, load in zip(client.perceived_server2_times, client.perceived_server2_loads):
        perceived_buckets[round(t.to_seconds(), 1)].append(load)
perceived_times = sorted(perceived_buckets.keys())
perceived_loads = [np.mean(perceived_buckets[t]) for t in perceived_times]
ax.plot(perceived_times, perceived_loads, "r--", label="Client Perceived Load", alpha=0.8, linewidth=1.5)

ax.axhline(y=0.9, color="orange", linestyle=":", alpha=0.7, label="Threshold (90%)")
add_spike_shading(ax)
ax.set_xlabel("Time (s)")
ax.set_ylabel("Load")
ax.set_title("Server 2: Actual Load vs Client Perception")
ax.legend(fontsize=8)
ax.grid(True, alpha=0.3)
ax.set_ylim(0, 1.5)

plt.tight_layout()
plt.show()

# --- Figure 3: Server Selection and Rehash Rate ---
fig, axes = plt.subplots(1, 2, figsize=(8, 3))

ax = axes[0]
hr_routing = [(t.to_seconds(), sid) for c in clients for t, (cid, sid) in zip(c.routing_times, c.routing_decisions) if cid == 1001]
if hr_routing:
    server_buckets = defaultdict(lambda: defaultdict(int))
    for t, sid in hr_routing:
        server_buckets[int(t)][sid] += 1
    bucket_times = sorted(server_buckets.keys())
    for sid in range(NUM_SERVERS):
        ax.plot(bucket_times, [server_buckets[b][sid] for b in bucket_times], label=f"Server{sid}", alpha=0.8)
add_spike_shading(ax)
ax.set_xlabel("Time (s)")
ax.set_ylabel("Requests/sec")
ax.set_title("Customer 1001 Server Selection")
ax.legend(fontsize=8)
ax.grid(True, alpha=0.3)

ax = axes[1]
rehash_by_time, request_by_time = defaultdict(int), defaultdict(int)
for client in clients:
    for t, (cid, chosen) in zip(client.routing_times, client.routing_decisions):
        bucket = int(t.to_seconds())
        request_by_time[bucket] += 1
        if chosen != hash(cid) % NUM_SERVERS:
            rehash_by_time[bucket] += 1
bucket_times = sorted(request_by_time.keys())
rehash_rates = [rehash_by_time[b]/request_by_time[b]*100 if request_by_time[b] else 0 for b in bucket_times]
ax.plot(bucket_times, rehash_rates, "g-", alpha=0.8)
add_spike_shading(ax)
ax.set_xlabel("Time (s)")
ax.set_ylabel("Rehash Rate (%)")
ax.set_title("Smart Routing Activity")
ax.grid(True, alpha=0.3)

plt.tight_layout()
plt.show()
```
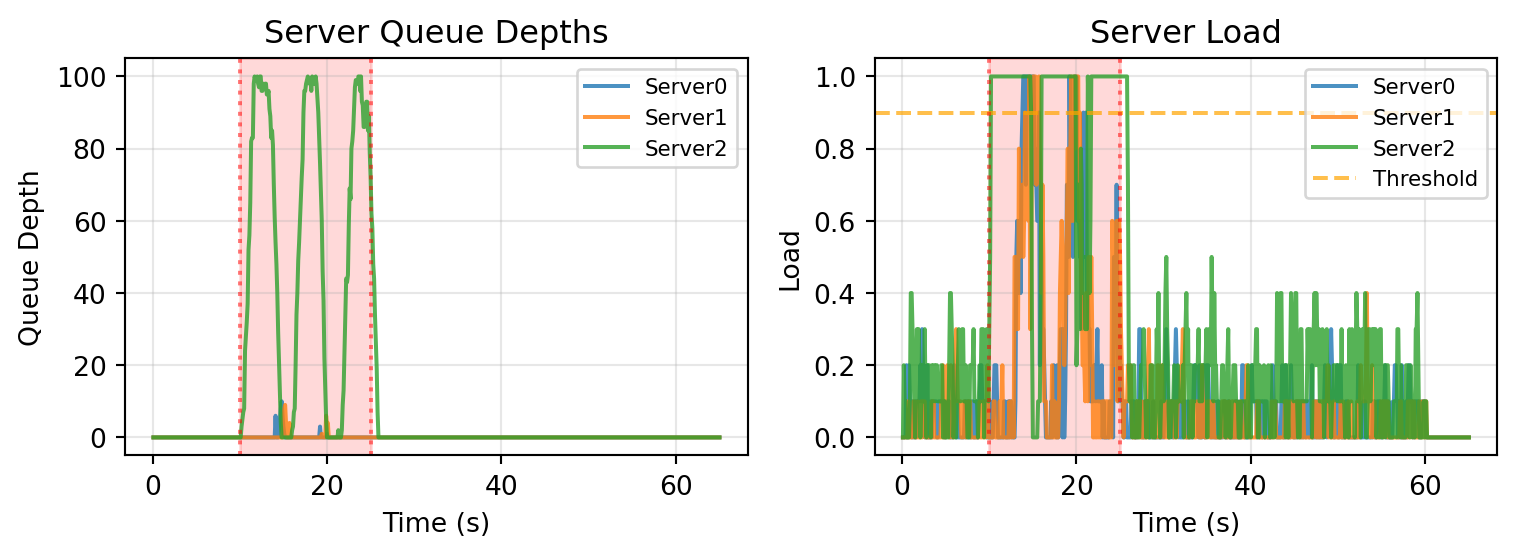
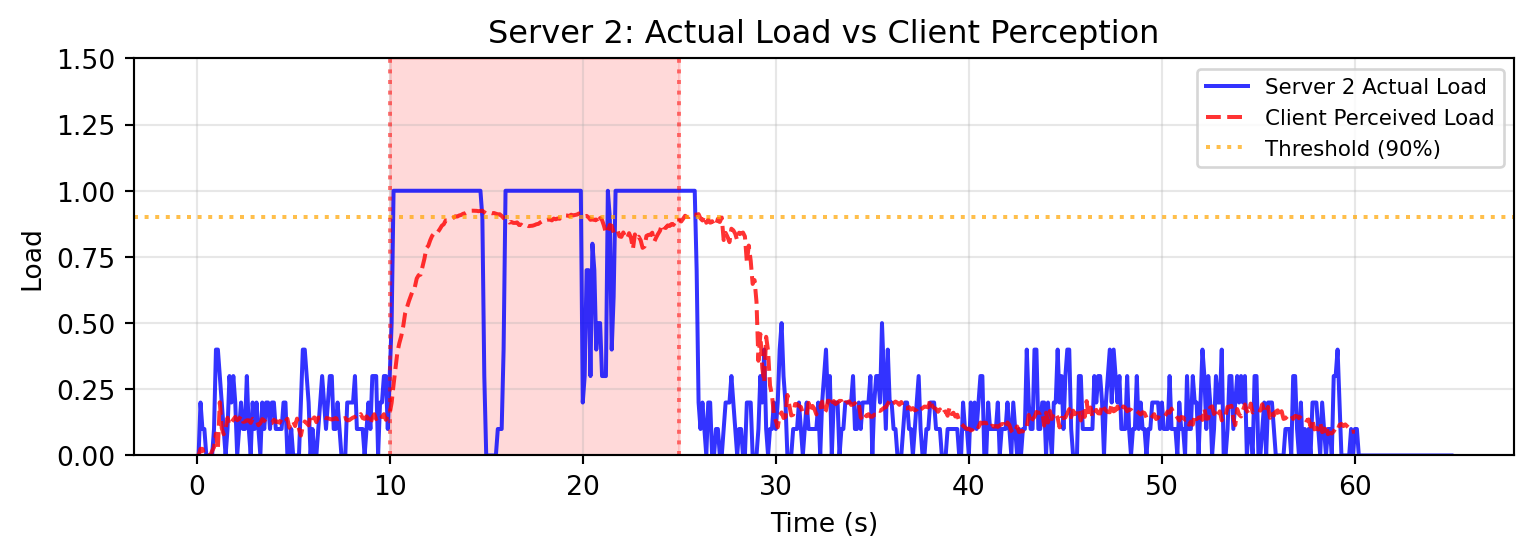
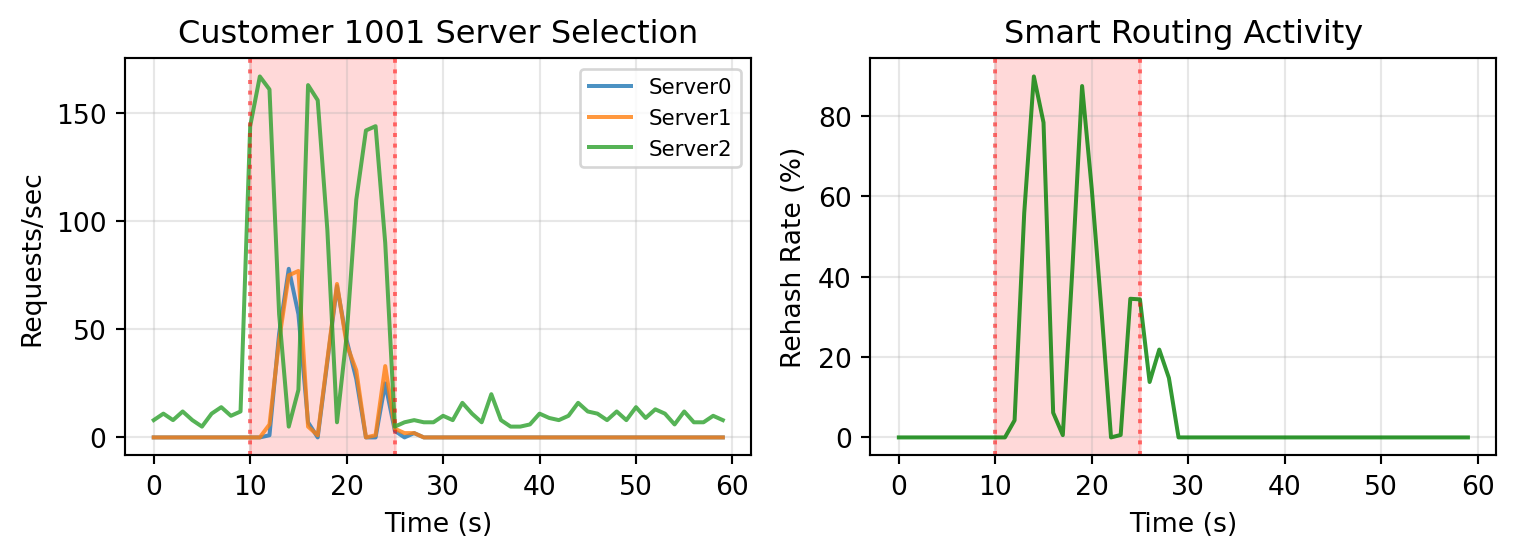
The results expose a common flaw in feedback-based control algorithms: oscillation [[3]](#references). As the load on Server 2 increases, the sliding window algorithm in the clients begins to detect server overload after a few seconds, and smart routing activates.
However, once the load is rebalanced, Server 2 is no longer in overload! Once enough time has passed and client windows are fresh, the system goes back to the overload state and the cycle repeats.
I gave my implementation to various AI models [with](https://gemini.google.com/share/47ec3f6d9198) and [without](https://gemini.google.com/share/3d1288806099) simulation data, and with this data the model is able to successfully identify the oscillation and root cause it, something that the model cannot deduce from the implementation alone.
With the proper hooks and simulation output and system prompts, I think it is very feasible to give AI models the proper sandbox to do what I call "simulation enhanced reasoning" and unlock some novel capabilities.
## Other work
Amazon seems to be the place where most distributed systems simulation progress is happening, they've long used formal (TLA+) and semi formal (P) methods, and seem to be developing a [log based analysis tool](https://p-org.github.io/P/advanced/pobserve/pobservecli/) as well. Not to mention some recent papers ( [one](https://sigops.org/s/conferences/hotos/2025/papers/hotos25-106.pdf), [two](https://arxiv.org/html/2510.03551v1) ) on the topic.
## References
1. Alvaro, Peter et al. "[Analyzing Metastable Failures](https://sigops.org/s/conferences/hotos/2025/papers/hotos25-106.pdf)." *HotOS '25*.
2. Alvaro, Peter et al. "[Formal Analysis of Metastable Failures in Software Systems](https://arxiv.org/html/2510.03551v1)." *arXiv*.
3. Andrews, Matthew and Aleksandrs Slivkins. "[Oscillations with TCP-like Flow Control in Networks of Queues](https://arxiv.org/abs/0812.1321)." *arXiv*, 2008.
4. "[Consistent hashing](https://en.wikipedia.org/wiki/Consistent_hashing)." *Wikipedia*.
5. "[Control theory](https://en.wikipedia.org/wiki/Control_theory)." *Wikipedia*.
6. "[Discrete-event simulation](https://en.wikipedia.org/wiki/Discrete-event_simulation)." *Wikipedia*.
7. Fillion, Adam. "[happy-simulator](https://github.com/adamfilli/happy-simulator/tree/main/happysimulator)." *GitHub*.